In a previous post I experimented with serverless monitoring of my websites. I was wondering if I could extend the monitoring functions to gather rudimentary data on the time it takes to load the site.
I decided to modify the Lambda function I used earlier to calculate the time it took for the function to read the response back from the server. This is most certainly not the best way to monitor page load times or any form of synthetic browser monitoring, but it gives me a bird’s-eye view of the trends and can alert me if for any reason this changes unexpectedly.
The python code I create is here:
Disclaimer: I am sure this can be optimised quite a bit, but it does illustrate the general idea).
import boto3
import urllib2
import socket
from time import time
import os


def write_metric(value, metric):

	d = boto3.client('cloudwatch')
	d.put_metric_data(Namespace='Web Status',
	                  MetricData=[
		                  {
	                  'MetricName':metric,
	                  'Dimensions':[
		                  {
	                  'Name': 'Status',
	                  'Value': 'Page Load Time',
		                  },
		                  ],
	                  'Value': value,
	},
	]
	                  )

def check_site(url):

	load_time = 0.005
	try:
		s = socket.socket(socket.AF_INET, socket.SOCK_STREAM)
		s.connect((url, 443))
	except socket.error, e:
		print("[Error:] Cannot connect to site %s" %url)
		return 0.005
	else:
		print("Checking %s Page Load time" % url)
		start_time = time()
		request = urllib2.Request("http://" + url)
		response = urllib2.urlopen(request)
		output = response.read()
		end_time = time()
		response.close()

		load_time = round(end_time-start_time, 3)

	return load_time


def lambda_handler(event, context):

	websiteurl = str(os.environ.get('websiteurl'))
	metricname = websiteurl + ' Page Load'

	r = check_site(websiteurl)
	print(websiteurl + " loaded in %r seconds" %r)
	write_metric(r, metricname)
As you can see it is similar to the SiteMonitoring function, the difference is here I measure the time between when the request is made and the data is read by the function:
	start_time = time()
	request = urllib2.Request("http://" + url)
	response = urllib2.urlopen(request)
	output = response.read()
	end_time = time()
	response.close()

	load_time = round(end_time-start_time, 3)
This of course, does not take into account the time required to execute client side js and many other variables, so the time required to render the page will be greater than the times calculated here.
Caveats
There are a couple of differences between this function and the one in my previous post:
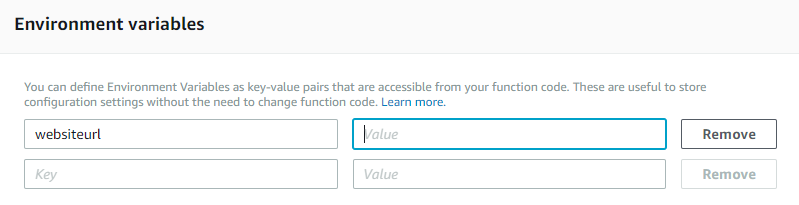
- Rather than hard-coding the site urls in the function, here I have used Lambda environment variables to pass the site url to the function:
websiteurl = str(os.environ.get('websiteurl'))
You can set the environment variables while creating/modifying the Lambda function as shown below
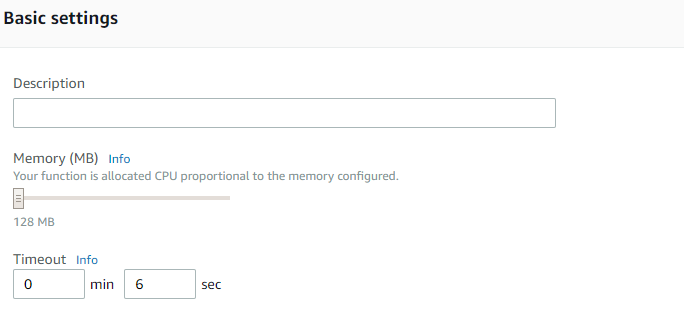
- Depending on the AWS Availabitliy Zone and the size of the page being tested, the default 3 second timeout may not be sufficient. Make sure to test the function and increase the timeout value accordingly. In my case, I had to increase it to 6 seconds to provide a buffer large enough for the function to execute completely to deal with unexpected spikes in page load time.
- I chose to run the page load function every hour, however even if it is run every half hour you will remain within the AWS Lambda free tier limits.
I hope this post has been helpful. There’s a fair bit of work going on in adapting Python and Selenium Webdriver with Headless Chrome to run as a Lambda function. I am still experimenting with this and will upload a post when I have got it working!