Lambda

Monitor Page load times using AWS Lambda

In a previous post I experimented with serverless monitoring of my websites.  I was wondering if I could extend the monitoring functions to gather rudimentary data on the time it takes to load the site.

I decided to modify the Lambda function I used earlier to calculate the time it took for the function to read the response back from the server.  This is most certainly not the best way to monitor page load times or any form of synthetic browser monitoring, but it gives me a bird’s-eye view of the trends and can alert me if for any reason this changes unexpectedly.

The python code I create is here:

Disclaimer: I am sure this can be optimised quite a bit, but it does illustrate the general idea).

import boto3
import urllib2
import socket
from time import time
import os


def write_metric(value, metric):

	d = boto3.client('cloudwatch')
	d.put_metric_data(Namespace='Web Status',
	                  MetricData=[
		                  {
	                  'MetricName':metric,
	                  'Dimensions':[
		                  {
	                  'Name': 'Status',
	                  'Value': 'Page Load Time',
		                  },
		                  ],
	                  'Value': value,
	},
	]
	                  )

def check_site(url):
	
	load_time = 0.005
	try:
		s = socket.socket(socket.AF_INET, socket.SOCK_STREAM)
		s.connect((url, 443))
	except socket.error, e:
		print("[Error:] Cannot connect to site %s" %url)
		return 0.005
	else:
		print("Checking %s Page Load time" % url)
		start_time = time()
		request = urllib2.Request("http://" + url)
		response = urllib2.urlopen(request)
		output = response.read()
		end_time = time()
		response.close()
		
		load_time = round(end_time-start_time, 3)
		
	return load_time


def lambda_handler(event, context):
	
	websiteurl = str(os.environ.get('websiteurl'))
	metricname = websiteurl + ' Page Load'
	
	r = check_site(websiteurl)
	print(websiteurl + " loaded in %r seconds" %r)
	write_metric(r, metricname)
Read More

Using AWS Lambda to monitor websites

I run a couple of websites for personal use, Nextcloud (an open source Dropbox alternative) and this WordPress site for personal use using a single EC2 instance.  As this architecture is susceptible to a host of problems due to a lack of redundancy, I needed a way to keep an eye on site availability and get notified if the websites were unavailable for any reason.

I had a couple of basic requirements:

  • The monitoring needed to be run outside the server to rule out any issues with the EC2 instance
  • The monitoring needed to check the websites from multiple locations
  • The monitoring needed to be free or as close to free as possible

There were a few ways I could solve this:

  • Use a managed service like pingdom, but the free tier is usually limited to only 1 url
  • install a dedicated monitoring solution
  • write a basic custom solution

I only need to check if the websites are up every 5 minutes, so any solution requiring the use of a virtual server or container that runs all the time would be a waste of resources, not to mention expensive.  As a result, I chose to use a serverless function that is triggered every 5 minutes using AWS Lambda which gives me solution that is “almost free”, i.e. a few cents a month.

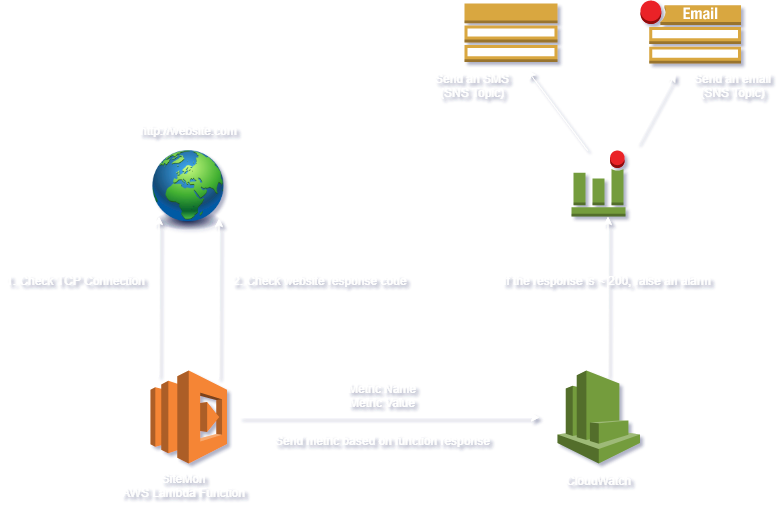
The basic architecture for this serverless monitoring is as follows:

  • Check the website using an AWS Lambda function
  • If a HTTP 200 or HTTP 304 is returned, the site is up and a metric value of 200 is sent to AWS CloudWatch
  • If anything else is returned the site is unavailable and a metric value of < 200 is sent to AWS CloudWatch so an alert can be raised.


Here’s a checklist of things that need to be in place for this to work:

  • The python script that will check website availability
  • AWS Simple Notification Service Topic
  • IAM Role (lambda_basic_execution) with the following permissions for the Lambda Function:
{
    "Version": "2012-10-17",
    "Statement": [
    {
        "Sid": "AllowLogCreation",
        "Effect": "Allow",
        "Action": [
            "logs:CreateLogStream",
            "logs:PutLogEvents",
            "logs:CreateLogGroup"
            ],
        "Resource": "arn:aws:logs:*:*:*"
    },
    {
    "Sid": "AllowMetricAlarmCreation",
    "Effect": "Allow",
    "Action": [
            "cloudwatch:PutMetricAlarm",
            "cloudwatch:PutMetricData"
            ],
        "Resource": "*"
        },
    ]
}

Read More