I run a couple of websites for personal use, Nextcloud (an open source Dropbox alternative) and this WordPress site for personal use using a single EC2 instance. As this architecture is susceptible to a host of problems due to a lack of redundancy, I needed a way to keep an eye on site availability and get notified if the websites were unavailable for any reason.
I had a couple of basic requirements:
- The monitoring needed to be run outside the server to rule out any issues with the EC2 instance
- The monitoring needed to check the websites from multiple locations
- The monitoring needed to be free or as close to free as possible
There were a few ways I could solve this:
- Use a managed service like pingdom, but the free tier is usually limited to only 1 url
- install a dedicated monitoring solution
- write a basic custom solution
I only need to check if the websites are up every 5 minutes, so any solution requiring the use of a virtual server or container that runs all the time would be a waste of resources, not to mention expensive. As a result, I chose to use a serverless function that is triggered every 5 minutes using AWS Lambda which gives me solution that is “almost free”, i.e. a few cents a month.
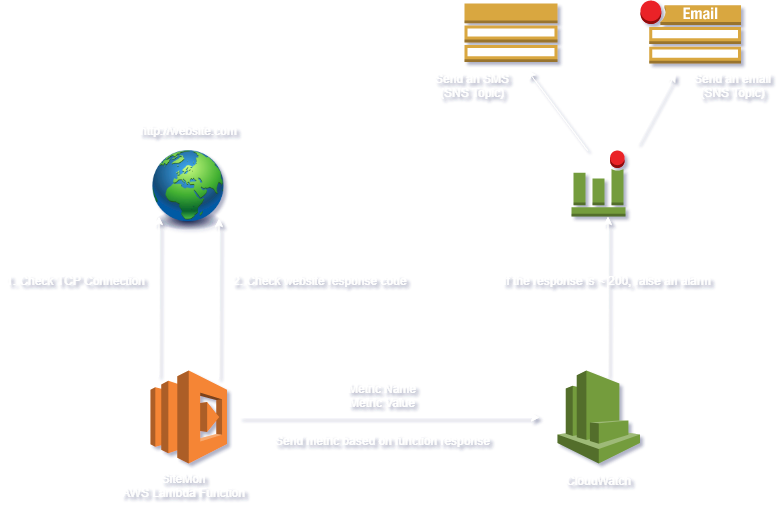
The basic architecture for this serverless monitoring is as follows:
- Check the website using an AWS Lambda function
- If a HTTP 200 or HTTP 304 is returned, the site is up and a metric value of 200 is sent to AWS CloudWatch
- If anything else is returned the site is unavailable and a metric value of < 200 is sent to AWS CloudWatch so an alert can be raised.
Here’s a checklist of things that need to be in place for this to work:
- The python script that will check website availability
- AWS Simple Notification Service Topic
- IAM Role (lambda_basic_execution) with the following permissions for the Lambda Function:
{
    "Version": "2012-10-17",
    "Statement": [
    {
        "Sid": "AllowLogCreation",
        "Effect": "Allow",
        "Action": [
            "logs:CreateLogStream",
            "logs:PutLogEvents",
            "logs:CreateLogGroup"
            ],
        "Resource": "arn:aws:logs:*:*:*"
    },
    {
    "Sid": "AllowMetricAlarmCreation",
    "Effect": "Allow",
    "Action": [
            "cloudwatch:PutMetricAlarm",
            "cloudwatch:PutMetricData"
            ],
        "Resource": "*"
        },
    ]
}
Setup & Configuration
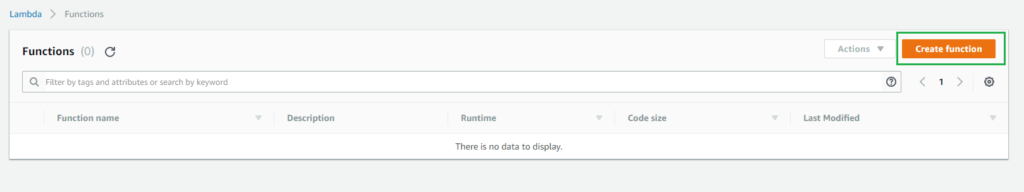
Lets start by creating a new Lambda function:
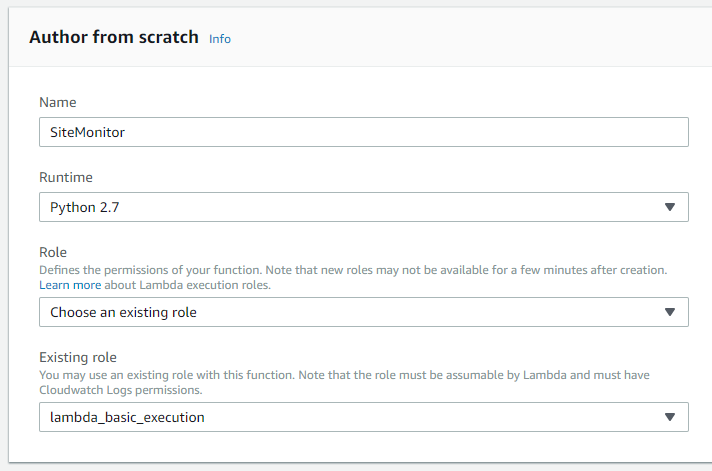
Ensure that you select the “Author from scratch” options and the following run time parameters:
In the code editor paste the following python function. I am not a python expert, and I am sure that this code can be optimised a fair bit, but it does work well enough for my purposes:
import boto3
import urllib2

def write_metric(value, metric):

	d = boto3.client('cloudwatch')
	d.put_metric_data(Namespace='Website Status',
	                  MetricData=[
		                  {
	                  'MetricName':metric,
	                  'Dimensions':[
		                  {
	                  'Name': 'Status',
	                  'Value': 'WebsiteStatusCode',
		                  },
		                  ],
	                  'Value': value,
	},
	]
	                  )

def check_site(url, metric):

	STAT = 1
	print("Checking %s " % url)
	request = urllib2.Request("http://" +url)

	try:
		response = urllib2.urlopen(request)
		response.close()
	except urllib2.URLError as e:
		if hasattr(e, 'code'):
			print ("[Error:] Connection to %s failed with code: " %url +str(e.code))
			STAT = 100
			write_metric(STAT, metric)
		if hasattr(e, 'reason'):
			print ("[Error:] Connection to %s failed with code: " % url +str(e.reason))
			STAT = 100
			write_metric(STAT, metric)
	except urllib2.HTTPError as e:
		if hasattr(e, 'code'):
			print ("[Error:] Connection to %s failed with code: " % url + str(e.code))
			STAT = 100
			write_metric(STAT, metric)
		if hasattr(e, 'reason'):
			print ("[Error:] Connection to %s failed with code: " % url + str(e.reason))
			STAT = 100
			write_metric(STAT, metric)
		print('HTTPError!!!')

	if STAT != 100:
		STAT = response.getcode()

	return STAT

def lambda_handler(event, context):

	# Change these to your actual websites.  Remember, the more websites you list
        # the longer the lambda function will run
	websiteurls = [
		"example.com",
		"example2.com",
		"test.com"
	]
	metricname = 'Site Availability'

	for site in websiteurls:
		r = check_site(site,metricname)
		if r == 200 or r == 304:
			print("Site %s is up" %site)
			write_metric(200, metricname)
		else:
			print("[Error:] Site %s down" %site)
			write_metric(50, metricname)
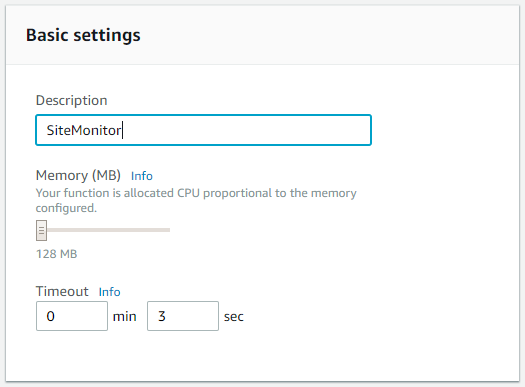
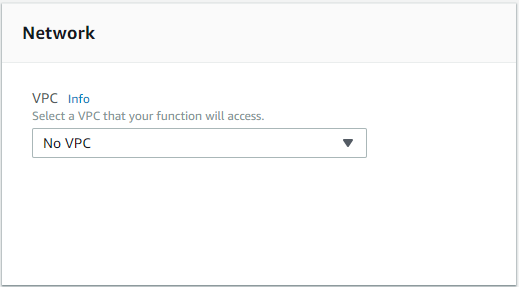
Set up the function’s Network, Memory utilisation and Timeout (leave the defaults in place)
Running the Lambda Function
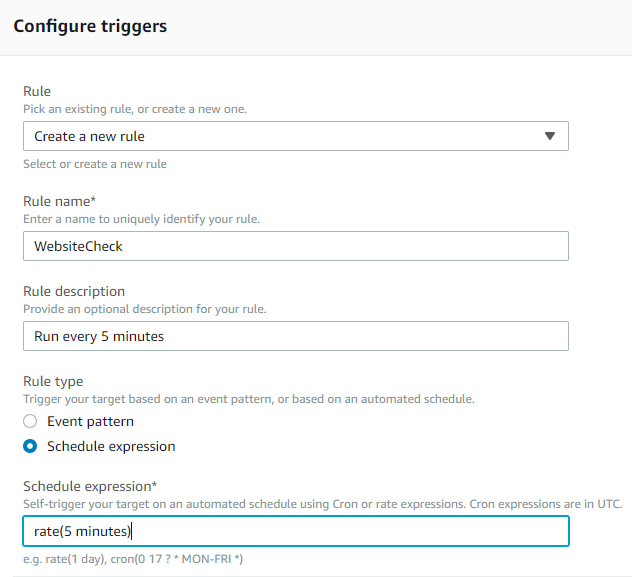
You can invoke a Lambda function in multiple ways, but my requirements are simple: Call the function every five minutes. To do this we can use CloudWatch Events as the trigger to call our SiteMonitor function.

Set up the CloudWatch Event to trigger the lambda function to run every 5 minutes by creating a rule as follows:
Alerts & Notifications
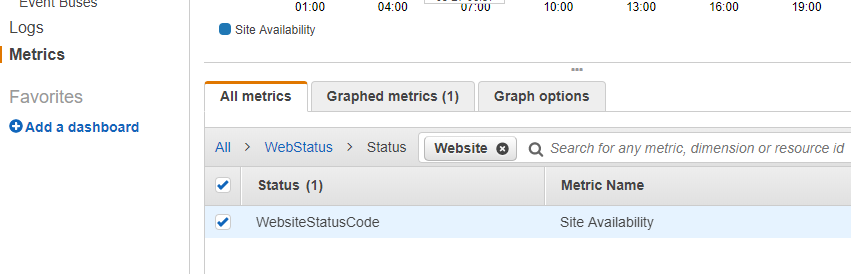
Create an AWS SNS Topic with at least one subscriber, either email or SMS. Once the SiteMonitor function has successfully run at least once you will see a new “Website Status” custom namespace under AWS CloudWatch Metrics. We can now use this metric to create alarms that will notify us if the website is down:
Using this metric an alarm can be setup to notify you if one of the monitored websites is down.
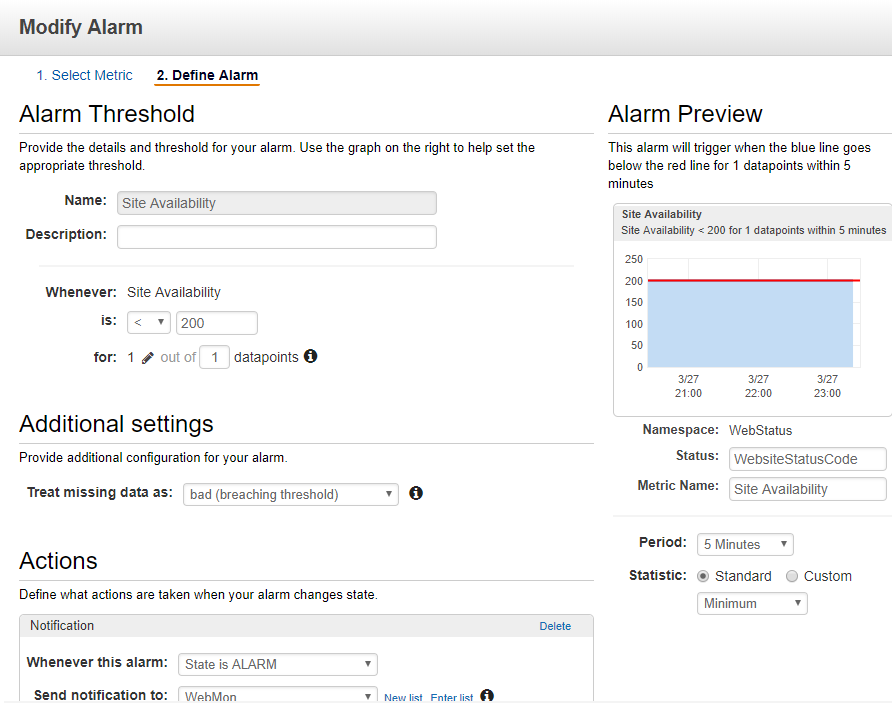
I have created an alert to notify me using the “WebMon” SNS Topic when the response code logged by the Lambda function is anything less than a HTTP 200 Ok.
How much does this cost?
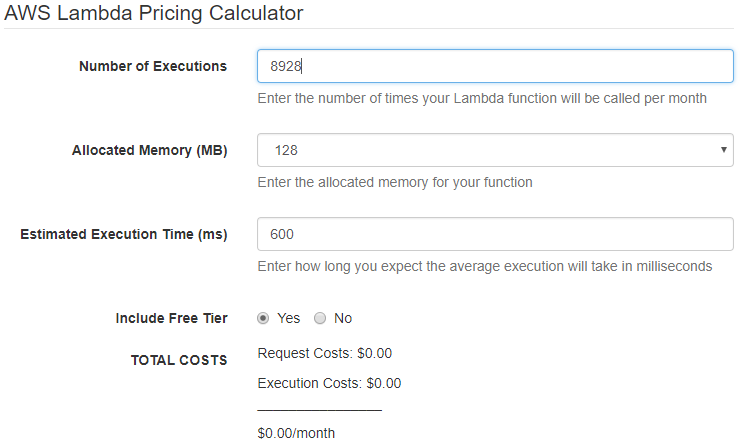
If you recall, one of my requirements was this monitoring solution to be free or as close to free as possible. The lambda function runs every 5 minutes, resulting in 8928 executions per month (31 days) with an average run time of ~ 600 ms. The AWS Lambda pricing is based on the number of requests and the duration of the request with a free tier giving all users 1 million requests & 400,000 GB-Seconds of compute time every month. Using the AWS Lambda Pricing Calculator, this works out to a total cost of $0/month!
All AWS customers also receive 10 custom CloudWatch Metrics and 10 Alarms at no cost.
That’s it! A simple, cheap way to keep an on you websites. I hope this post proves helpful, its in no way perfect and any feedback will be great!
Comments
Met
Thanks for sharing this. How are you resetting the alarm to OK state? My alarms don’t set to OK once they are gets to “In Alarm”
Dario Ravera
I’ve been playing around with Lambda and CW for a while and this solution is exactly what I needed to go along with the rest of my website recovery process.
Thank you for sharing it!
Dario